+--- GitHub Organization
    +--- Project 1
        +--- master
        +--- feature-branch-a
        +--- feature-branch-b
    +--- Project 2
        +--- master
        +--- pull-request-1
+--- etc...Pipeline as Code
Pipeline as Code describes a set of features that allow Jenkins users to define pipelined job processes with code, stored and versioned in a source repository. These features allow Jenkins to discover, manage, and run jobs for multiple source repositories and branches — eliminating the need for manual job creation and management.
To use Pipeline as Code, projects must contain a file named Jenkinsfile in the repository root, which contains a "Pipeline script."
Additionally, one of the enabling jobs needs to be configured in Jenkins:
-
Multibranch Pipeline: build multiple branches of a single repository automatically
-
Organization Folders: scan a GitHub Organization or Bitbucket Team to discover an organization’s repositories, automatically creating managed Multibranch Pipeline jobs for them
-
Pipeline: Regular Pipeline jobs have an option when specifying the pipeline to "Use SCM".
Fundamentally, an organization’s repositories can be viewed as a hierarchy, where each repository may have child elements of branches and pull requests.
Prior to _Multibranch Pipeline_ jobs and _Organization Folders_,
plugin:cloudbees-folder[Folders]
could be used to create this hierarchy in Jenkins by organizing repositories
into folders containing jobs for each individual branch.
Multibranch Pipeline and Organization Folders eliminate the manual process by detecting branches and repositories, respectively, and creating appropriate folders with jobs in Jenkins automatically.
The Jenkinsfile
Presence of the Jenkinsfile in the root of a repository makes it eligible for Jenkins to automatically manage and execute jobs based on repository branches.
The Jenkinsfile should contain a Pipeline script, specifying the steps to execute the job.
The script has all the power of Pipeline available, from something as simple as invoking a Maven builder, to a series of interdependent steps, which have coordinated parallel execution with deployment and validation phases.
A simple way to get started with Pipeline is to use the Snippet Generator available in the configuration screen for a Jenkins Pipeline job. Using the Snippet Generator, you can create a Pipeline script as you might through the dropdowns in other Jenkins jobs.
Multibranch Pipeline and Organization Folder
Multibranch Pipeline projects and GitHub Organization Folders extend Jenkins' folder functionality by introducing computed folders, which automatically manage their contents by dynamically creating and updating child items. These features require the GitHub Branch Source plugin to be installed, as it provides the necessary functionality for managing branches and repositories.
-
Multibranch Pipeline Projects: The computed folder functionality includes Scan Multibranch Pipeline Log and Scan Multibranch Pipeline Now options, which dynamically manage pipeline items. These options allow Jenkins to scan repositories, generate child items for eligible branches, and automatically update the pipeline list based on changes.
-
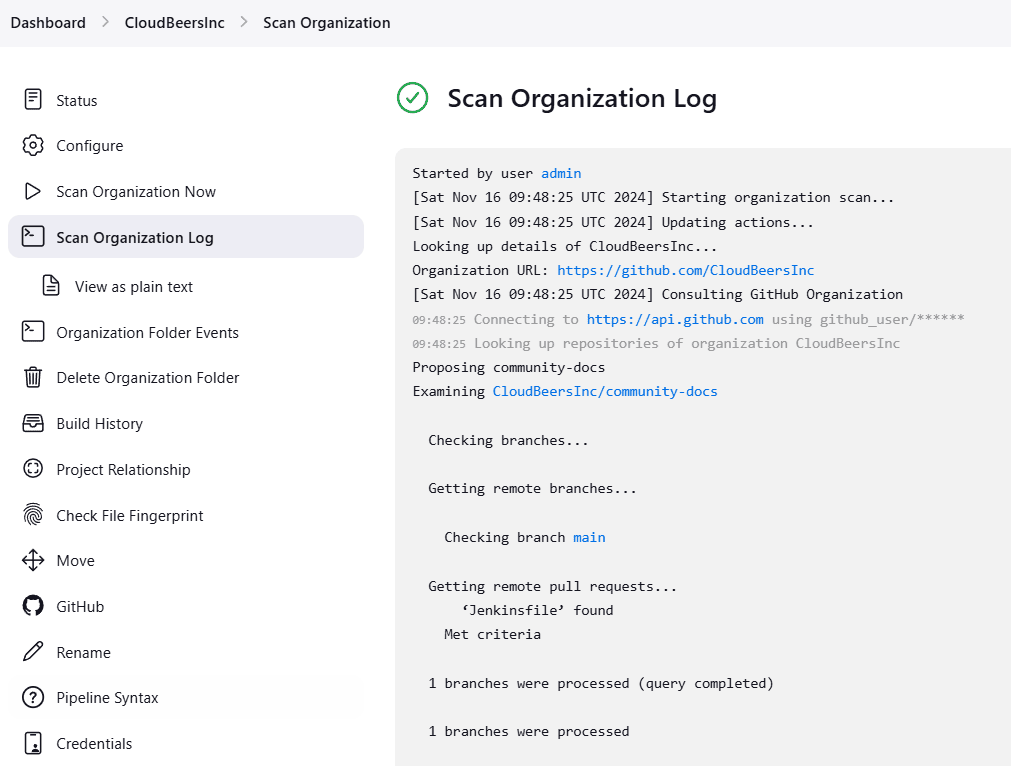
GitHub Organization Projects: The computed folder functionality includes Scan Organization Log and Scan Organization Now options. This functionality populates repositories as individual Multibranch Pipelines and provides insights into branch and repository scans.
Folder scans can be automatically triggered through webhook callbacks whenever branches or repositories are created or removed. Scans can also be configured to run periodically via the Build Triggers settings, which default to a re-scan after one day of inactivity.

The log from the last attempt to scan the organization is available in the Scan Organization Log. If the scan doesn’t produce the expected set of repositories, the log may contain useful information to help diagnose the issue.
Configuration
Both Multibranch Pipeline projects and Organization Folders have configuration options to allow precise selection of repositories. These features also allow selection of two types of credentials to use when connecting to the remote systems:
-
scan credentials, which are used for accessing the GitHub or Bitbucket APIs
-
checkout credentials, which are used when the repository is cloned from the remote system; it may be useful to choose an SSH key or "- anonymous -", which uses the default credentials configured for the OS user
| If you are using a GitHub Organization, you should create a GitHub access token to use to avoid storing your password in Jenkins and prevent any issues when using the GitHub API. When using a GitHub access token, you must use standard Username with password credentials, where the username is the same as your GitHub username and the password is your access token. |
Multibranch Pipeline Projects
Multibranch Pipeline projects are one of the fundamental enabling features for Pipeline as Code.
Changes to the build or deployment procedure can evolve with project requirements and the job always reflects the current state of the project.
It also allows you to configure different jobs for different branches of the same project, or to forgo a job if appropriate.
The Jenkinsfile in the root directory of a branch or pull request identifies a multibranch project.
Multibranch Pipeline projects expose the name of the branch being built with the BRANCH_NAME environment variable and provide a special checkout scm Pipeline command, which is guaranteed to check out the specific commit that the Jenkinsfile originated.
If the Jenkinsfile needs to check out the repository for any reason, make sure to use checkout scm, as it also accounts for alternate origin repositories to handle things like pull requests.
|
To create a Multibranch Pipeline, go to: New Item → Multibranch Pipeline. Configure the SCM source as appropriate. There are options for many different types of repositories and services including Git, Mercurial, Bitbucket, and GitHub. If using GitHub, for example, click Add source, select GitHub and configure the appropriate owner, scan credentials, and repository.
Other options available to Multibranch Pipeline projects are:
-
API endpoint - an alternate API endpoint to use a self-hosted GitHub Enterprise
-
Checkout credentials - alternate credentials to use when checking out the code (cloning)
-
Include branches - a regular expression to specify branches to include
-
Exclude branches - a regular expression to specify branches to exclude; note that this will take precedence over includes
-
Property strategy - if necessary, define custom properties for each branch
After configuring these items and saving the configuration, Jenkins will automatically scan the repository and import appropriate branches.
Organization Folders
Organization Folders offer a convenient way to allow Jenkins to automatically manage which repositories are automatically included in Jenkins.
Particularly, if your organization utilizes GitHub Organizations or Bitbucket Teams, any time a developer creates a new repository
with a Jenkinsfile, Jenkins will automatically detect it and create a Multibranch Pipeline project for it.
This alleviates the need for administrators or developers to manually create projects for these new repositories.
To create an Organization Folder in Jenkins, go to: New Item → Organization Folder or New Item → Bitbucket Team and follow the configuration steps for each item, making sure to specify appropriate Scan Credentials and a specific owner for the GitHub Organization or Bitbucket Team name, respectively.
Other options available are:
-
Repository name pattern - a regular expression to specify which repositories are included
-
API endpoint - an alternate API endpoint to use a self-hosted GitHub Enterprise
-
Checkout credentials - alternate credentials to use when checking out the code (cloning)
After configuring these items and saving the configuration, Jenkins will automatically scan the organization and import appropriate repositories and resulting branches.
Orphaned Item Strategy
Computed folders can remove items immediately or leave them based on a desired retention strategy. By default, items will be removed as soon as the folder computation determines they are no longer present. If your organization requires these items remain available for a longer period of time, simply configure the Orphaned Item Strategy appropriately. It may be useful to keep items in order to examine build results of a branch after it’s been removed, for example.

Icon and View Strategy
You can also configure a custom icon for folder display by installing the Custom Folder Icon plugin. For example, it might be useful to display an aggregate health of the child builds. Alternately, you might reference the same icon you use in your GitHub organization account.
Example
To demonstrate using an Organization Folder to manage repositories, we’ll use the fictitious organization: CloudBeers, Inc..
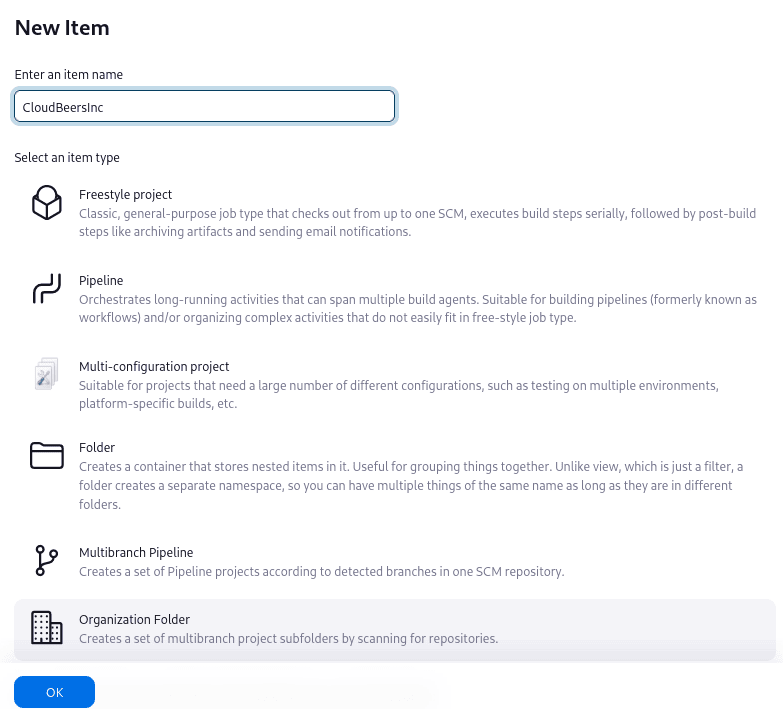
Go to New Item. Enter 'CloudBeersInc' for the item name. Select Organization Folder and click OK.
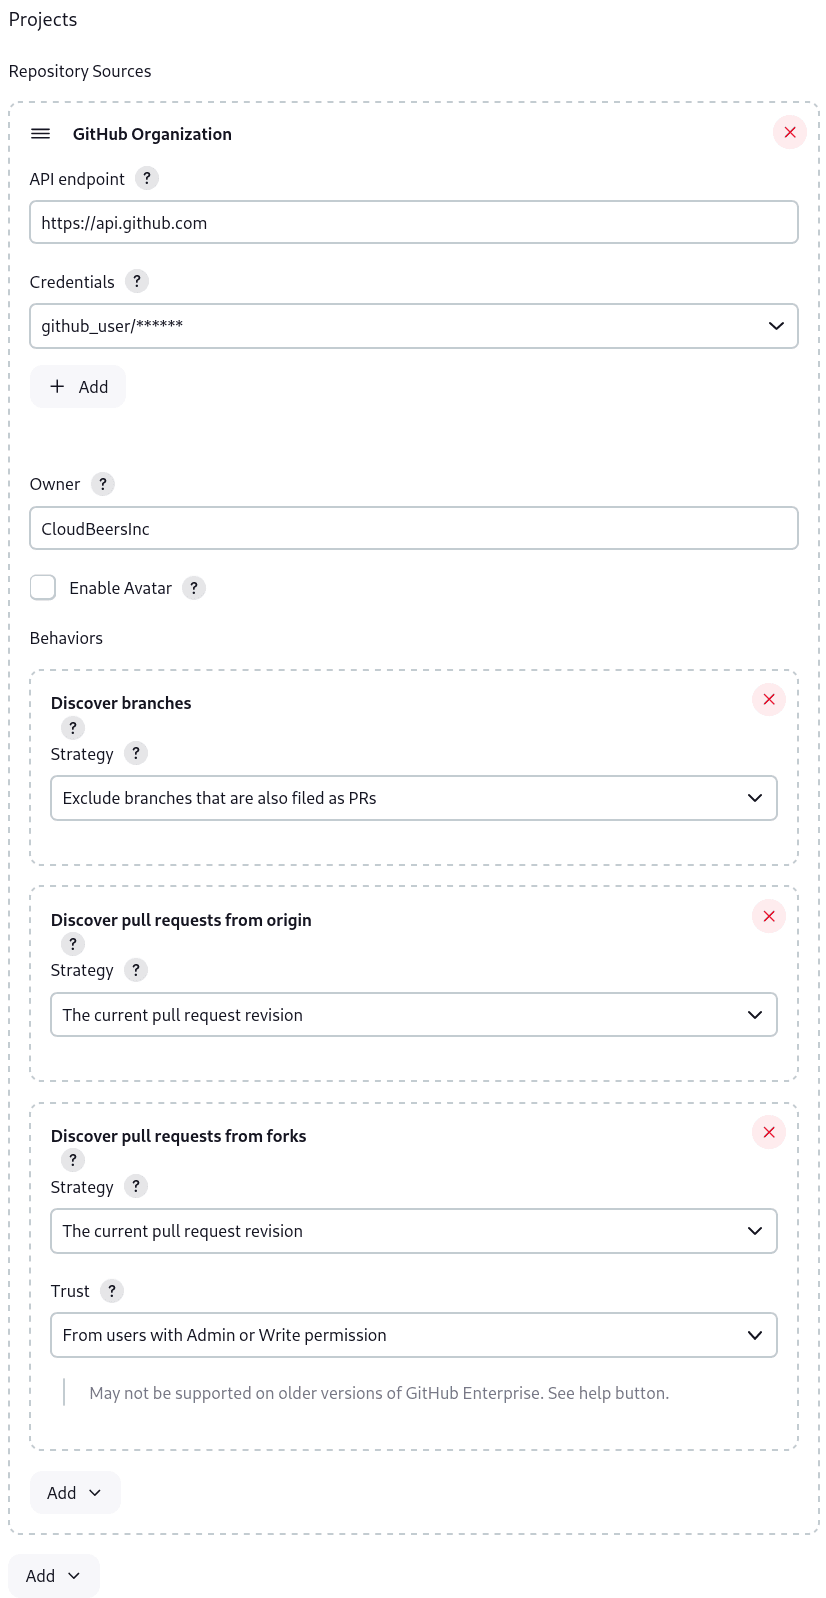
Optionally, enter a better descriptive name for the Description, such as 'CloudBeers GitHub'. In the Repository Sources section, complete the section for "GitHub Organization". Make sure the owner matches the GitHub Organization name exactly, in our case it must be: CloudBeersInc. This defaults to the same value that was entered for the item name in the first step. Next, select or add new Credentials - we’ll enter our GitHub username and access token as the password.
After saving, the "Folder Computation" will run to scan for eligible repositories, followed by multibranch builds.
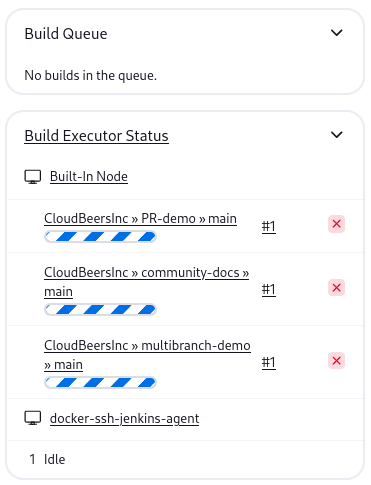
Refresh the page after the job runs to ensure the view of repositories has been updated.
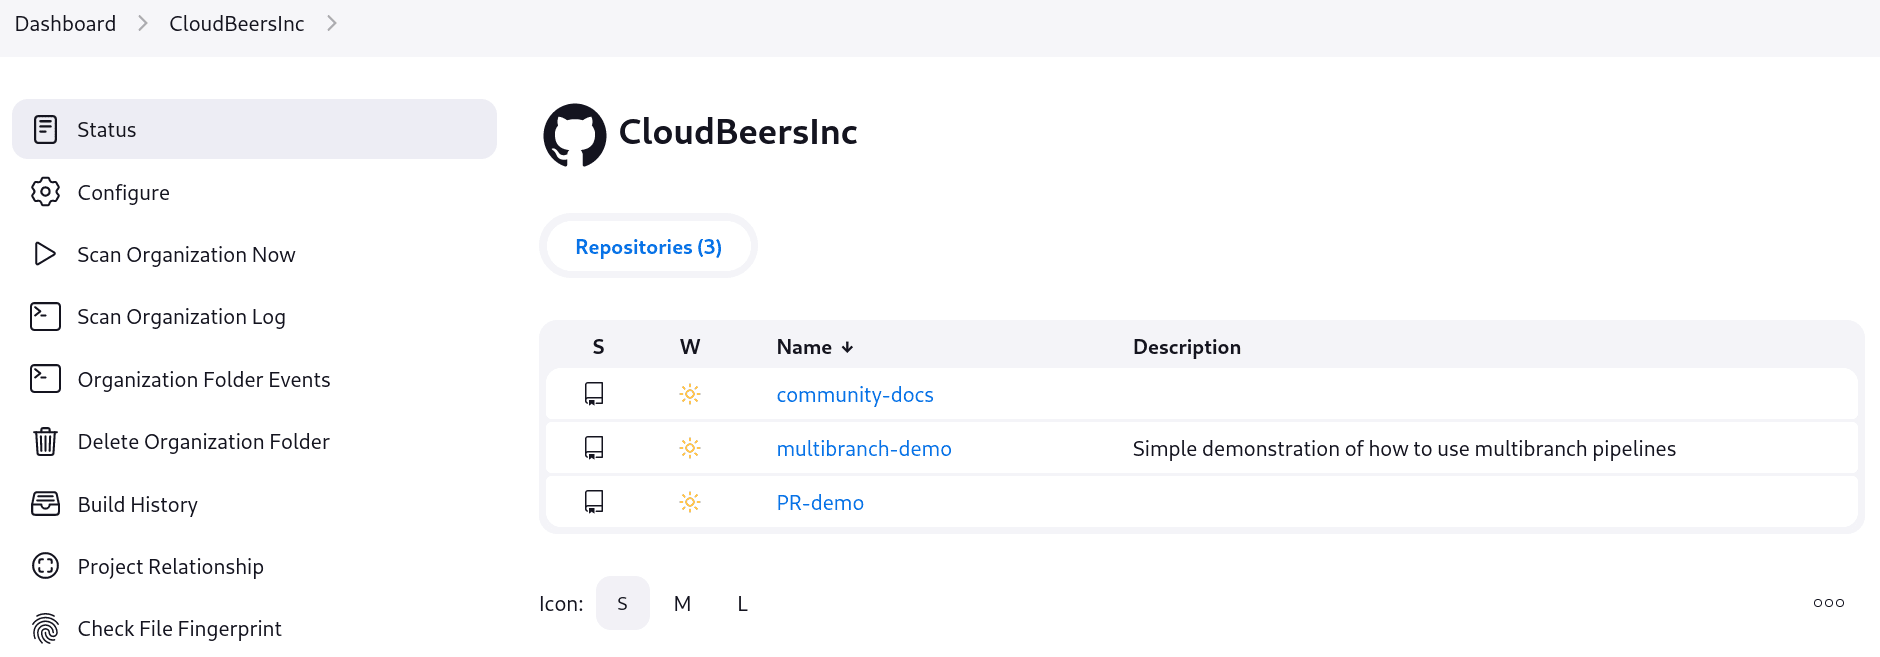
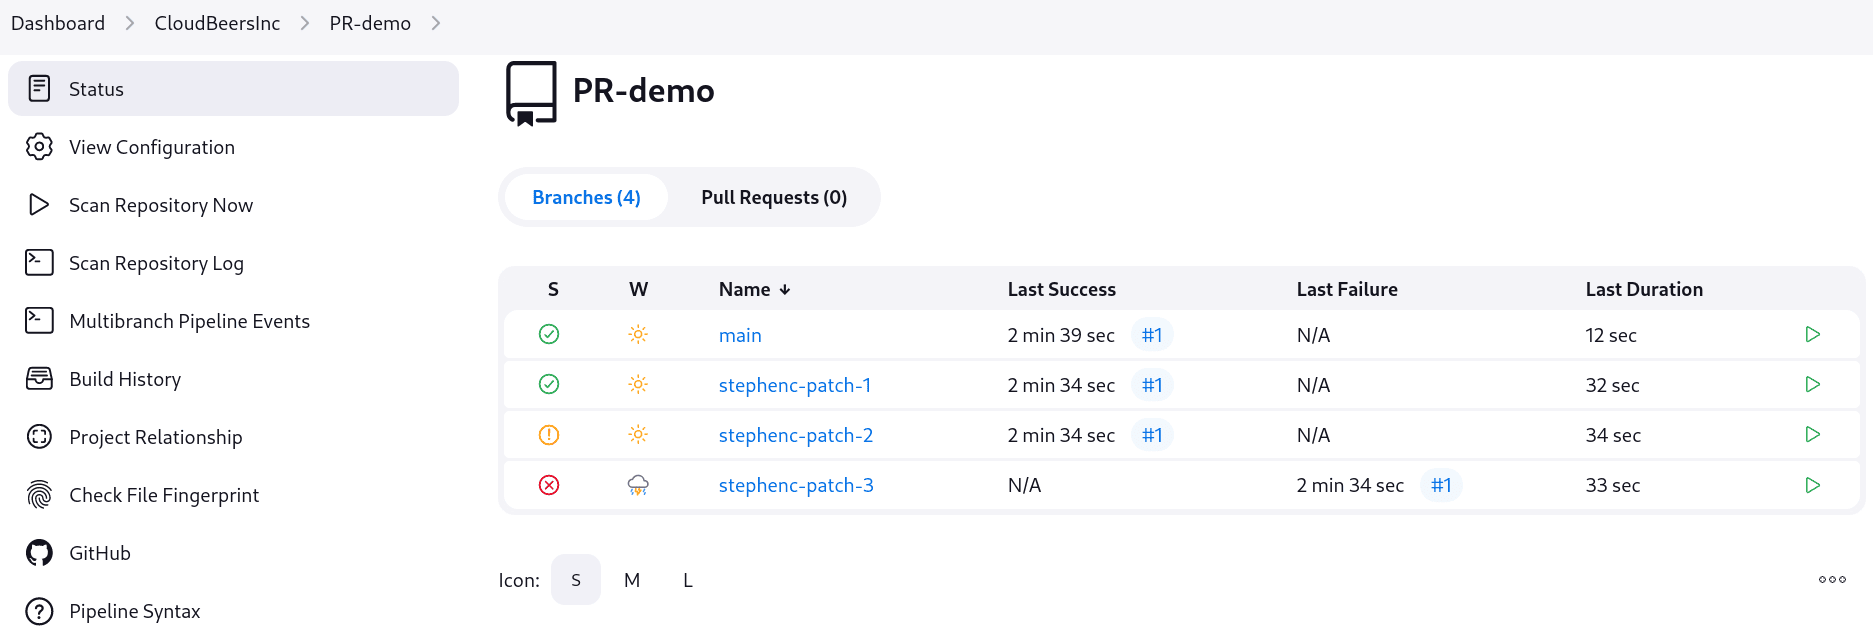
At this point, you’re finished with basic project configuration and can now explore your imported repositories. You can also investigate the results of the jobs run as part of the initial Folder Computation.
Continuous Delivery with Pipeline
Continuous delivery allows organizations to deliver software with lower risk. The path to continuous delivery starts by modeling the software delivery pipeline used within the organization and then focusing on the automation of it all. Early, directed feedback, enabled by pipeline automation enables software delivery more quickly over traditional methods of delivery.
Jenkins is the Swiss army knife in the software delivery toolchain. Developers and operations (DevOps) personnel have different mindsets and use different tools to get their respective jobs done. Since Jenkins integrates with a huge variety of toolsets, it serves as the intersection point between development and operations teams.
Many organizations have been orchestrating pipelines with existing Jenkins plugins for several years. As their automation sophistication and their own Jenkins experience increases, organizations inevitably want to move beyond simple pipelines and create complex flows specific to their delivery process.
These Jenkins users require a feature that treats complex pipelines as a first-class object, and so the Pipeline plugin was developed.
Pre-requisites
Continuous delivery is a process - rather than a tool - and requires a mindset and culture that must percolate from the top-down within an organization. Once the organization has bought into the philosophy, the next and most difficult part is mapping the flow of software as it makes its way from development to production.
The root of such a pipeline will always be an orchestration tool like a Jenkins, but there are some key requirements that such an integral part of the pipeline must satisfy before it can be tasked with enterprise-critical processes:
-
Zero or low downtime disaster recovery: A commit, just as a mythical hero, encounters harder and longer challenges as it makes its way down the pipeline. It is not unusual to see pipeline executions that last days. A hardware or a Jenkins failure on day six of a seven-day pipeline has serious consequences for on-time delivery of a product.
-
Audit runs and debug ability: Build managers like to see the exact execution flow through the pipeline, so they can easily debug issues.
To ensure a tool can scale with an organization and suitably automate existing delivery pipelines without changing them, the tool should also support:
-
Complex pipelines: Delivery pipelines are typically more complex than canonical examples (linear process: Dev→Test→Deploy, with a couple of operations at each stage). Build managers want constructs that help parallelize parts of the flow, run loops, perform retries and so forth. Stated differently, build managers want programming constructs to define pipelines.
-
Manual interventions: Pipelines cross intra-organizational boundaries necessitating manual handoffs and interventions. Build managers seek capabilities such as being able to pause a pipeline for a human to intervene and make manual decisions.
The Pipeline plugin allows users to create such a pipeline through a new job type called Pipeline. The flow definition is captured in a Groovy script, thus adding control flow capabilities such as loops, forks and retries. Pipeline allows for stages with the option to set concurrencies, preventing multiple builds of the same pipeline from trying to access the same resource at the same time.
Concepts
There is just one job to capture the entire software delivery pipeline in an organization. Of course, you can still connect two Pipeline job types together if you want. A Pipeline job type uses a Groovy-based DSL for job definitions. The DSL affords the advantage of defining jobs programmatically:
node('linux'){
  git url: 'https://github.com/jglick/simple-maven-project-with-tests.git'
  def mvnHome = tool 'M3'
  env.PATH = "${mvnHome}/bin:${env.PATH}"
  sh 'mvn -B clean verify'
}Intra-organizational (or conceptual) boundaries are captured through a primitive called "stages." A deployment pipeline consists of various stages, where each subsequent stage builds on the previous one. The idea is to spend as few resources as possible early in the pipeline and find obvious issues, rather than spend a lot of computing resources for something that is ultimately discovered to be broken.

Consider a simple pipeline with three stages. A naive implementation of this pipeline can sequentially trigger each stage on every commit. Thus, the deployment step is triggered immediately after the Selenium test steps are complete. However, this would mean that the deployment from commit two overrides the last deployment in motion from commit one. The right approach is for commits two and three to wait for the deployment from commit one to complete, consolidate all the changes that have happened since commit one and trigger the deployment. If there is an issue, developers can easily figure out if the issue was introduced in commit two or commit three.
Pipeline provides this functionality by enhancing the stage primitive. For example, a stage can have a concurrency level of one defined to indicate that at any point only one thread should be running through the stage. This achieves the desired state of running a deployment as fast as it should run.
 stage name: 'Production', concurrency: 1
 node {
     unarchive mapping: ['target/x.war' : 'x.war']
     deploy 'target/x.war', 'production'
     echo 'Deployed to http://localhost:8888/production/'
}Continuous delivery means having binaries in a release ready state whereas continuous deployment means pushing the binaries to production - or automated deployments. Although continuous deployment is a sexy term and a desired state, in reality organizations still want a human to give the final approval before bits are pushed to production. This is captured through the "input" primitive in Pipeline. The input step can wait indefinitely for a human to intervene.
input message: "Does http://localhost:8888/staging/ look good?"Deployment of binaries is the last mile in a pipeline. The numerous servers employed within the organization and available in the market make it difficult to employ a uniform deployment step. Today, these are solved by third-party deployer products whose job it is to focus on deployment of a particular stack to a data center. Teams can also write their own extensions to hook into the Pipeline job type and make the deployment easier.
Meanwhile, job creators can write a plain old Groovy function to define any custom steps that can deploy (or undeploy) artifacts from production.
def deploy(war, id) {
    sh "cp ${war} /tmp/webapps/${id}.war"
}All Pipelines are resumable, so if Jenkins needs to be restarted while a flow is running, it should resume at the same point in its execution after Jenkins starts back up. Similarly, if a flow is running a lengthy sh or bat step when an agent unexpectedly disconnects, no progress should be lost when connectivity is restored.
There are some cases when a flow build will have done a great deal of work and proceeded to a point where a transient error occurred: one which does not reflect the inputs to this build, such as source code changes. For example, after completing a lengthy build and test of a software component, final deployment to a server might fail because of network problems.
When you have complex builds pipelines, it is useful to see the progress of each stage and to see where build failures are occurring in the pipeline. This can enable users to debug which tests are failing at which stage or if there are other problems in their pipeline. Many organization also want to make their pipelines user-friendly for non-developers without having to develop a homegrown UI, which can prove to be a lengthy and ongoing development effort.
The Pipeline Stage View feature offers extended visualization of Pipeline build history on the index page of a flow project. This visualization also includes helpful metrics like average run time by stage and by build, and a user-friendly interface for interacting with input steps.
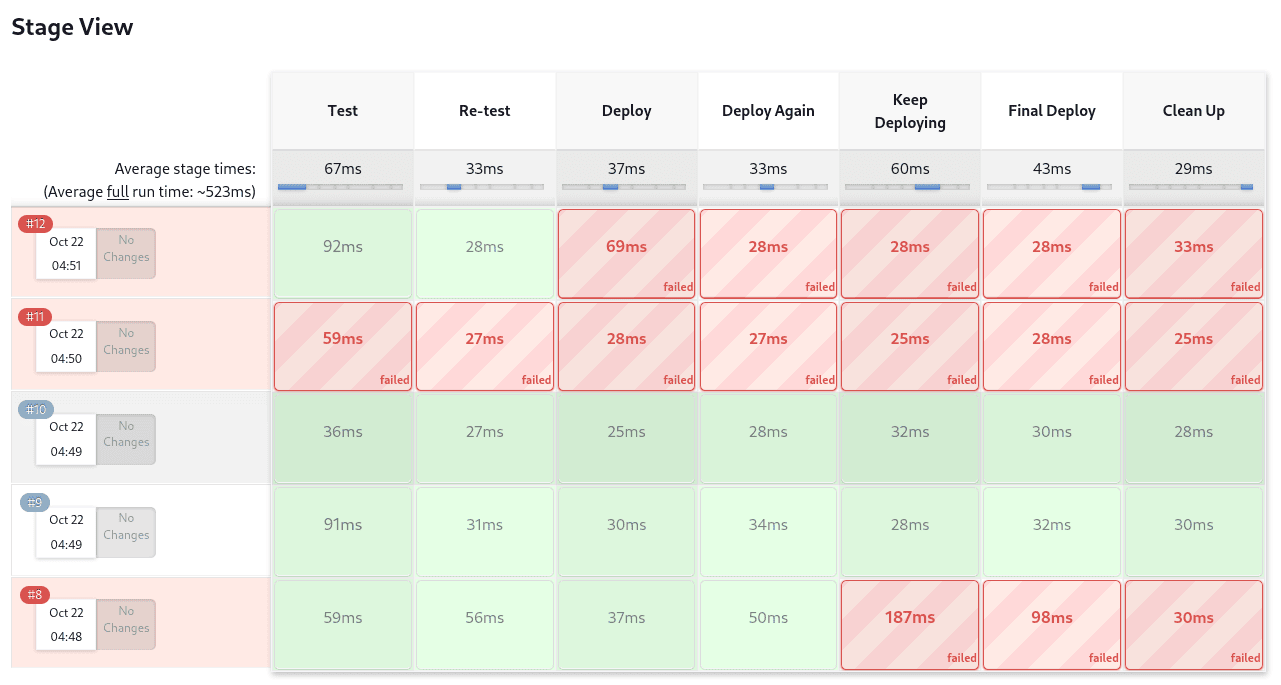
The only prerequisite for this plugin is a pipeline with defined stages in the flow. There can be as many stages as you desired and they can be in a linear sequence, and the stage names will be displayed as columns in the Stage View interface.
Artifact traceability with fingerprints
Traceability is important for DevOps teams who need to be able to trace code from commit to deployment. It enables impact analysis by showing relationships between artifacts and allows for visibility into the full lifecycle of an artifact, from its code repository to where the artifact is eventually deployed in production.
Jenkins and the Pipeline feature support tracking versions of artifacts using file fingerprinting, which allows users to trace which downstream builds are using any given artifact. To fingerprint with Pipeline, simply add a "fingerprint: true" argument to any artifact archiving step. For example:
archiveArtifacts artifacts: '**', fingerprint: truewill archive any WAR artifacts created in the Pipeline and fingerprint them for traceability. This trace log of this artifact and a list of all fingerprinted artifacts in a build will then be available in the left-hand menu of Jenkins:
To find where an artifact is used and deployed to, simply follow the "more details" link through the artifact’s name and view the entries for the artifact in its "Usage" list.

Visit the fingerprint documentation to learn more.